The shift meeting starts on the loss
The ranking is on screen, with no spreadsheet built overnight, and the discussion goes straight to the top cause.
The problem Nobody can say how much the plant really produces, or where it loses.
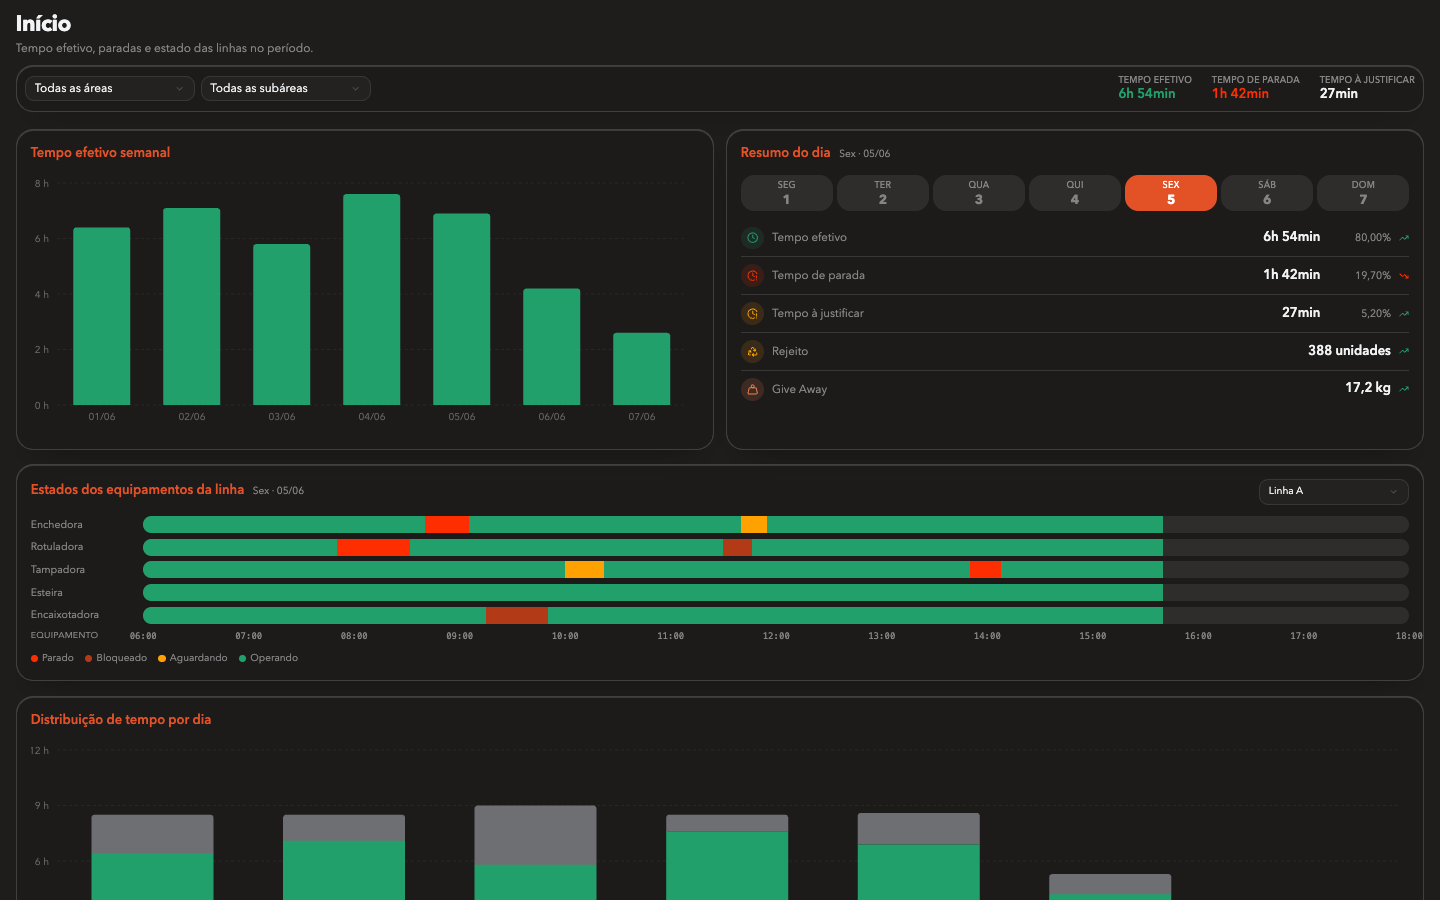
How much your plant really produces, and where it loses: downtime, rejects and losses by line and shift.
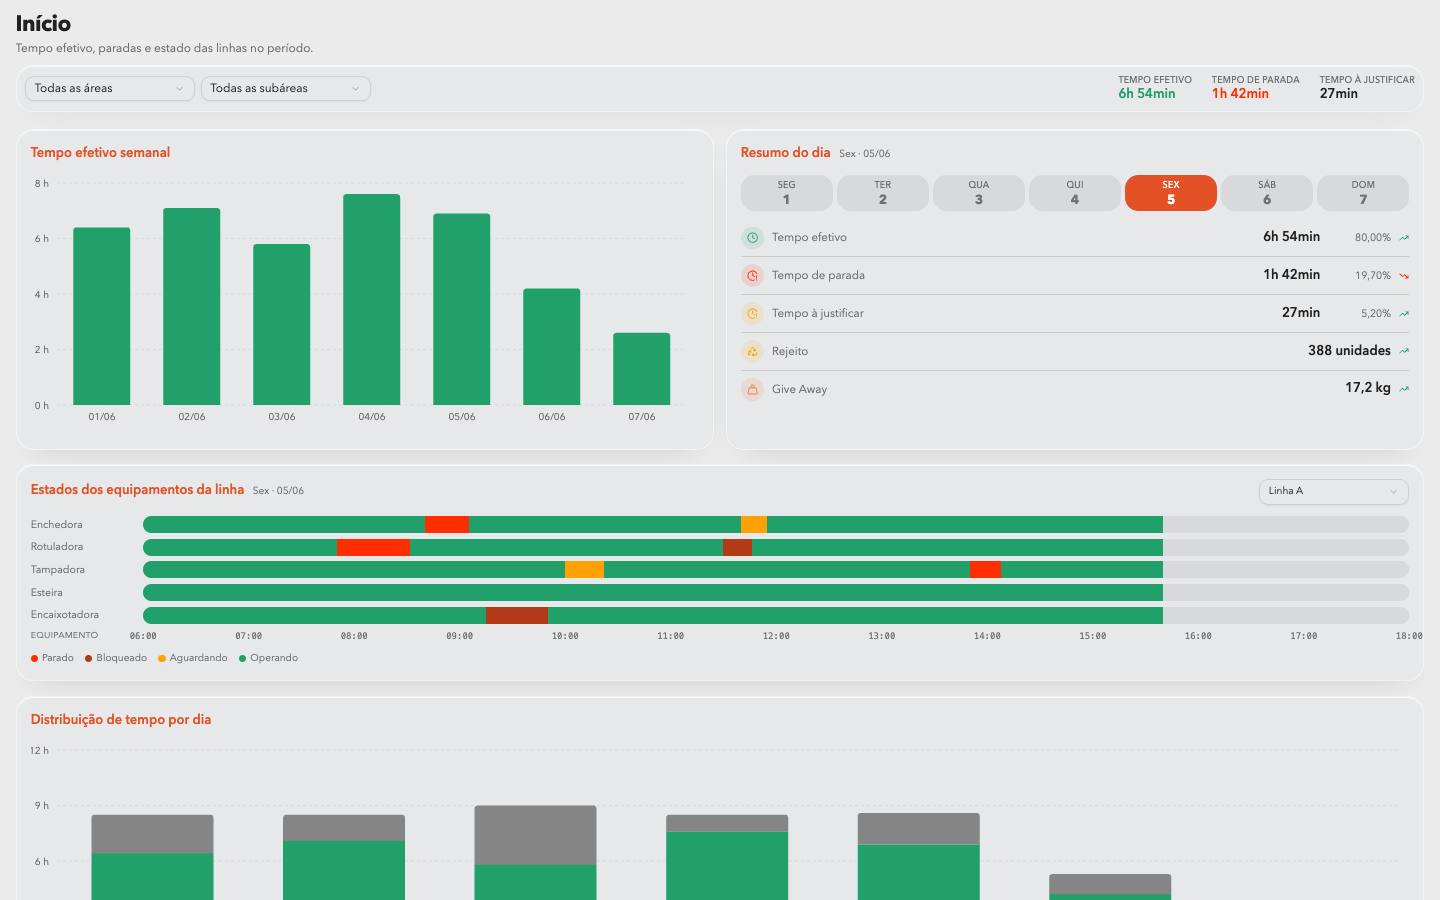
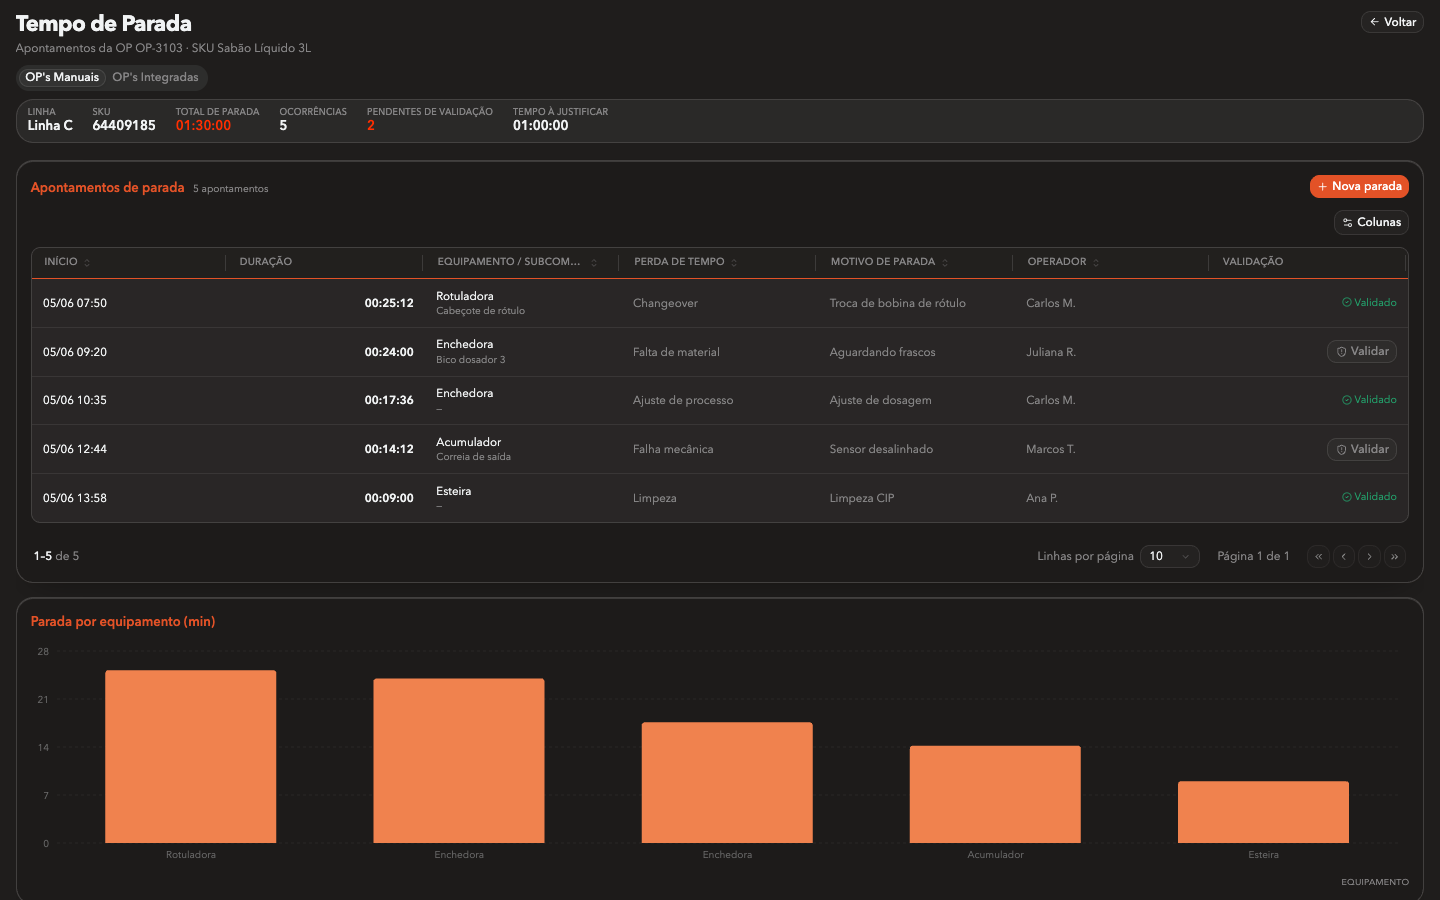
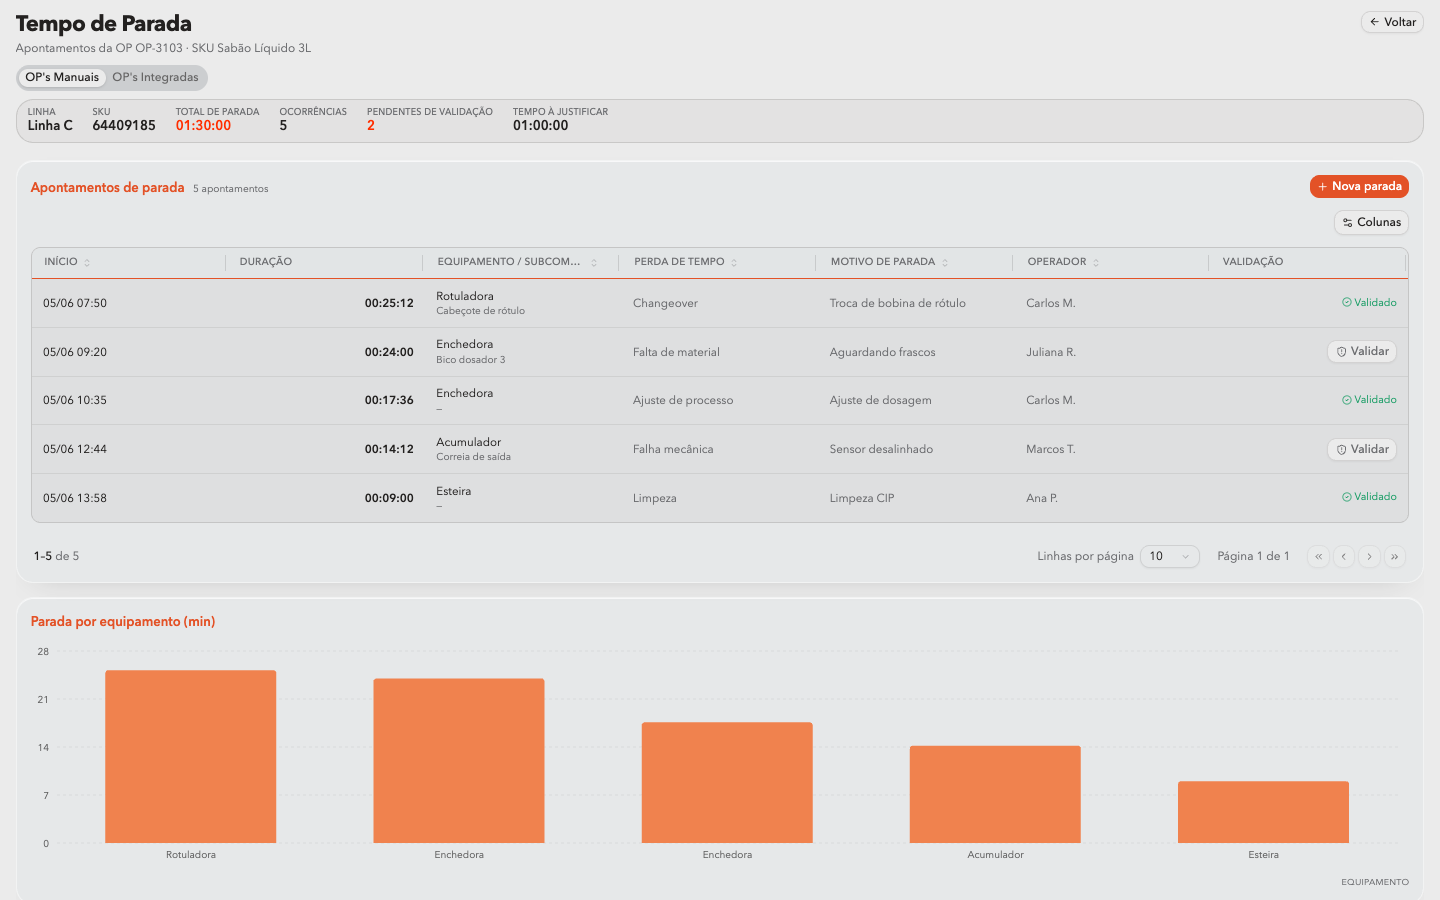
Counts, stops, reasons and rejects arrive per line, shift and product, from the floor or from the equipment itself.
Every minute lands somewhere: availability, performance or quality. Each stop hangs on a reason from your own tree.
By line, shift and product, against the target, in real time and in history.
When the indicator falls, the ranked losses come with it, so the shift meeting starts on the biggest one.
Production reporting
This is the hard requirement. Without it, the capability has nothing to read.
The ranking is on screen, with no spreadsheet built overnight, and the discussion goes straight to the top cause.
Compare rate and losses side by side and see whether the gap is the machine, the setup or the shift.
Micro stops add up in the record and stop being a feeling about the operator.
The operator logs the stop as it happens, with a reason from the plant's own tree, and sees the effect on the shift indicator.
Rejects and rework come in as quality loss, with the same number quality already uses.
Efficiency by line, shift and product against the target, with the loss that explains every drop.
Every capability reads from and feeds the others. What this one exchanges inside the operation:
Both read the same production reporting. Efficiency says what capacity is real, the plan says what the line was supposed to deliver.
Plant level loss says how much. The process stage says which equipment, and at which point of the process.
Rejects reported in quality become the quality loss in the indicator, with the same number on both sides.
Bring one week of production reporting. In the demo we calculate your OEE and open the loss tree with you.