IPM

Monitor the process

The problem The process only shows up at the end, never stage by stage.
intellifix · Monitor the process Process home
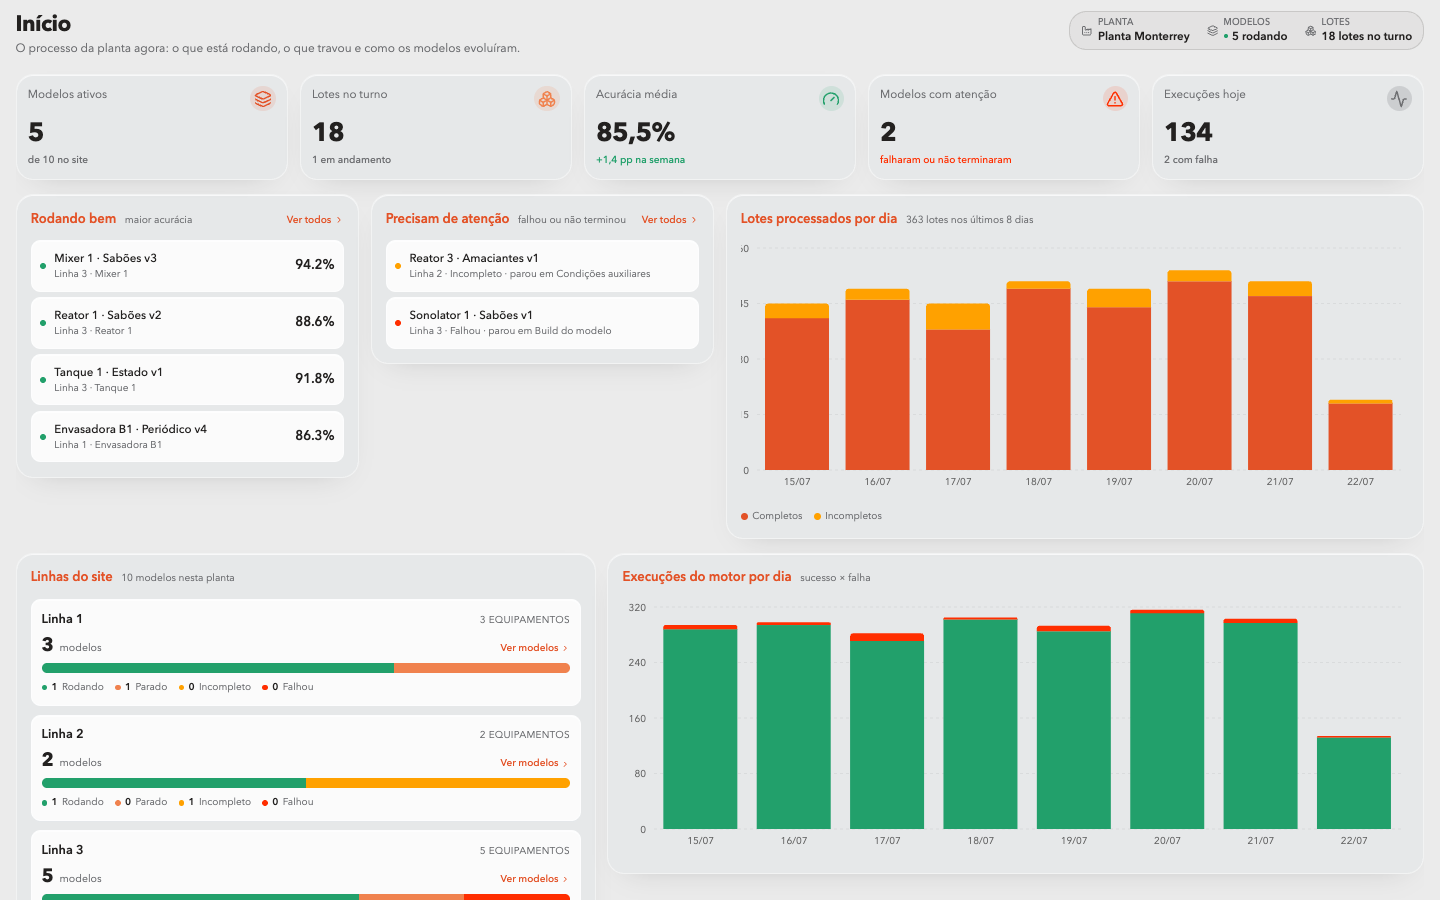
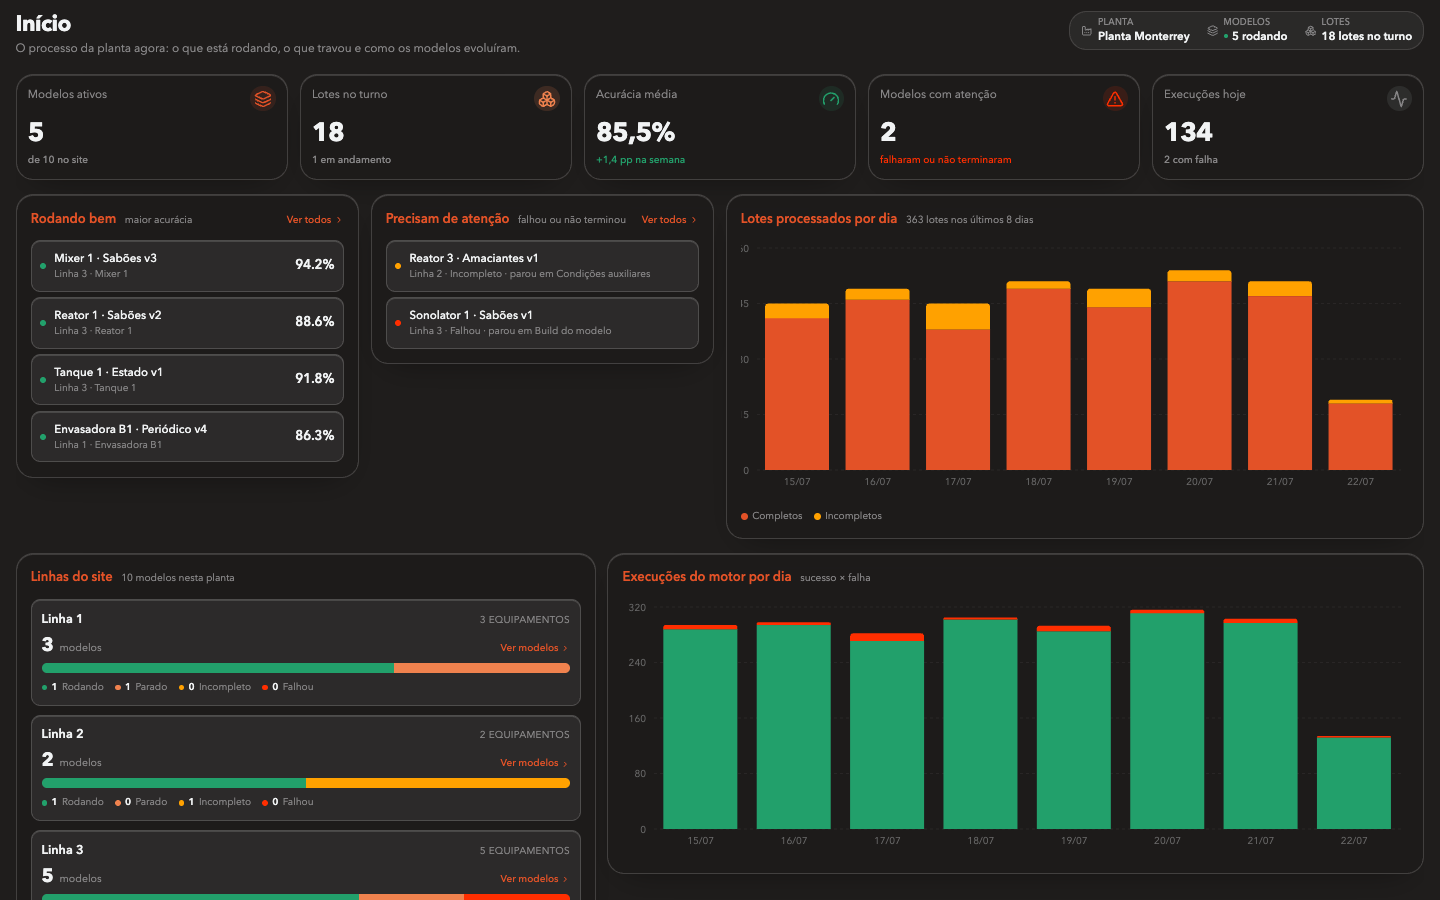
Real product screen: Process home
Data it needs
Process tags (plug and play)
Areas of the operation
Production · Energy
Integrates with
APC · OEE · RMS
How it goes live
14-day free trial
What it does

The process, stage by stage, while it runs.

Every process stage with each equipment's losses, live.

  • Stage-by-stage view of the process, live
  • Losses isolated per equipment
  • Plug-and-play tags, no integration project
Real screens

This is the product, not a mockup.

Captures of the running app with demonstration data. Click a screen to open it full size.
intellifix · IPM Real product screen
Real product screen: Process home
Process home Enlarge
intellifix · IPM Real product screen
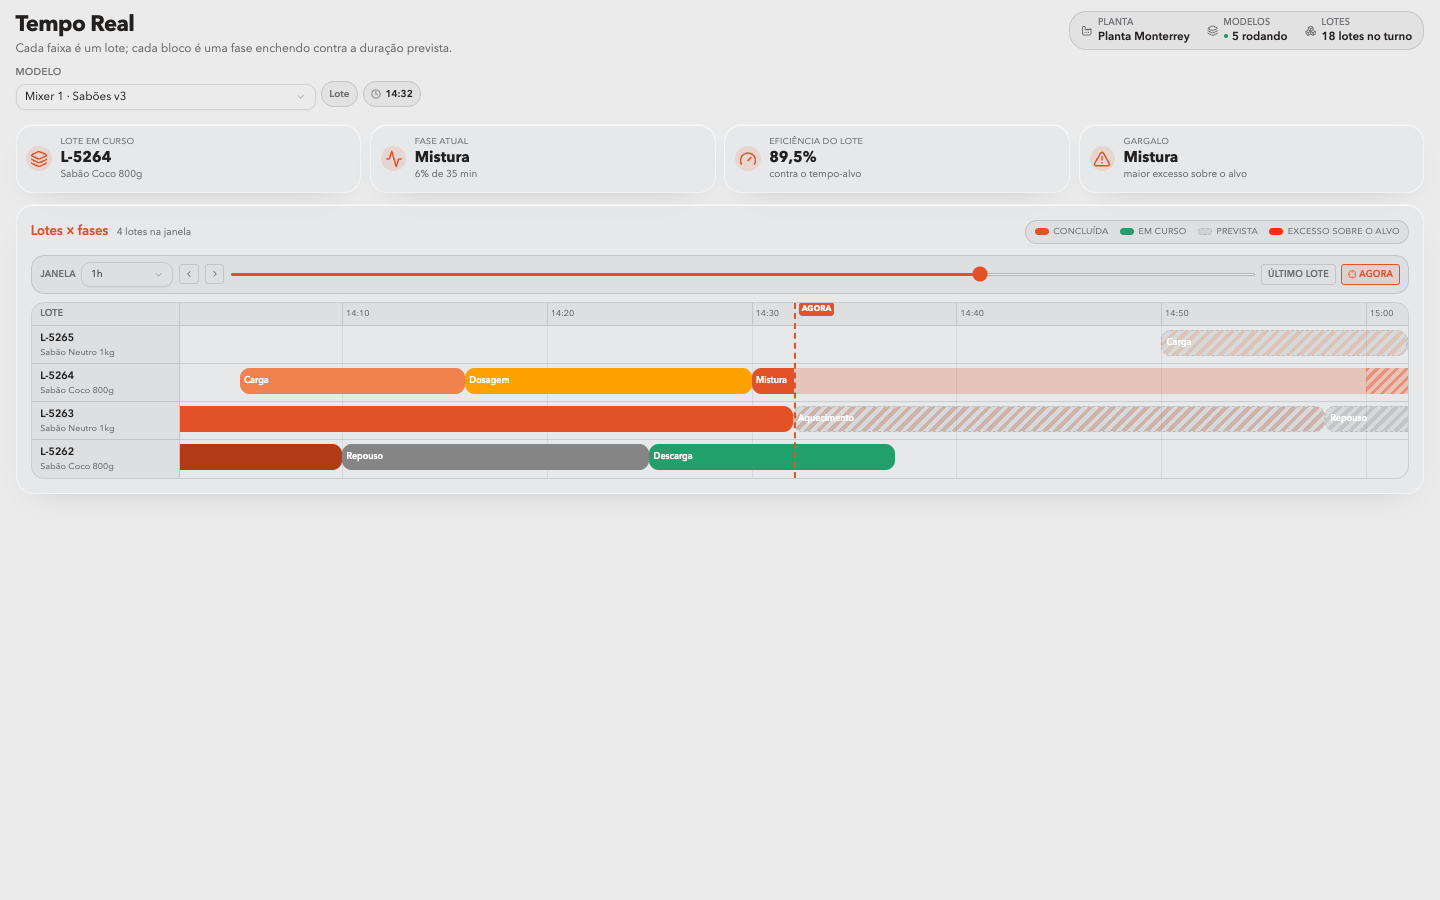
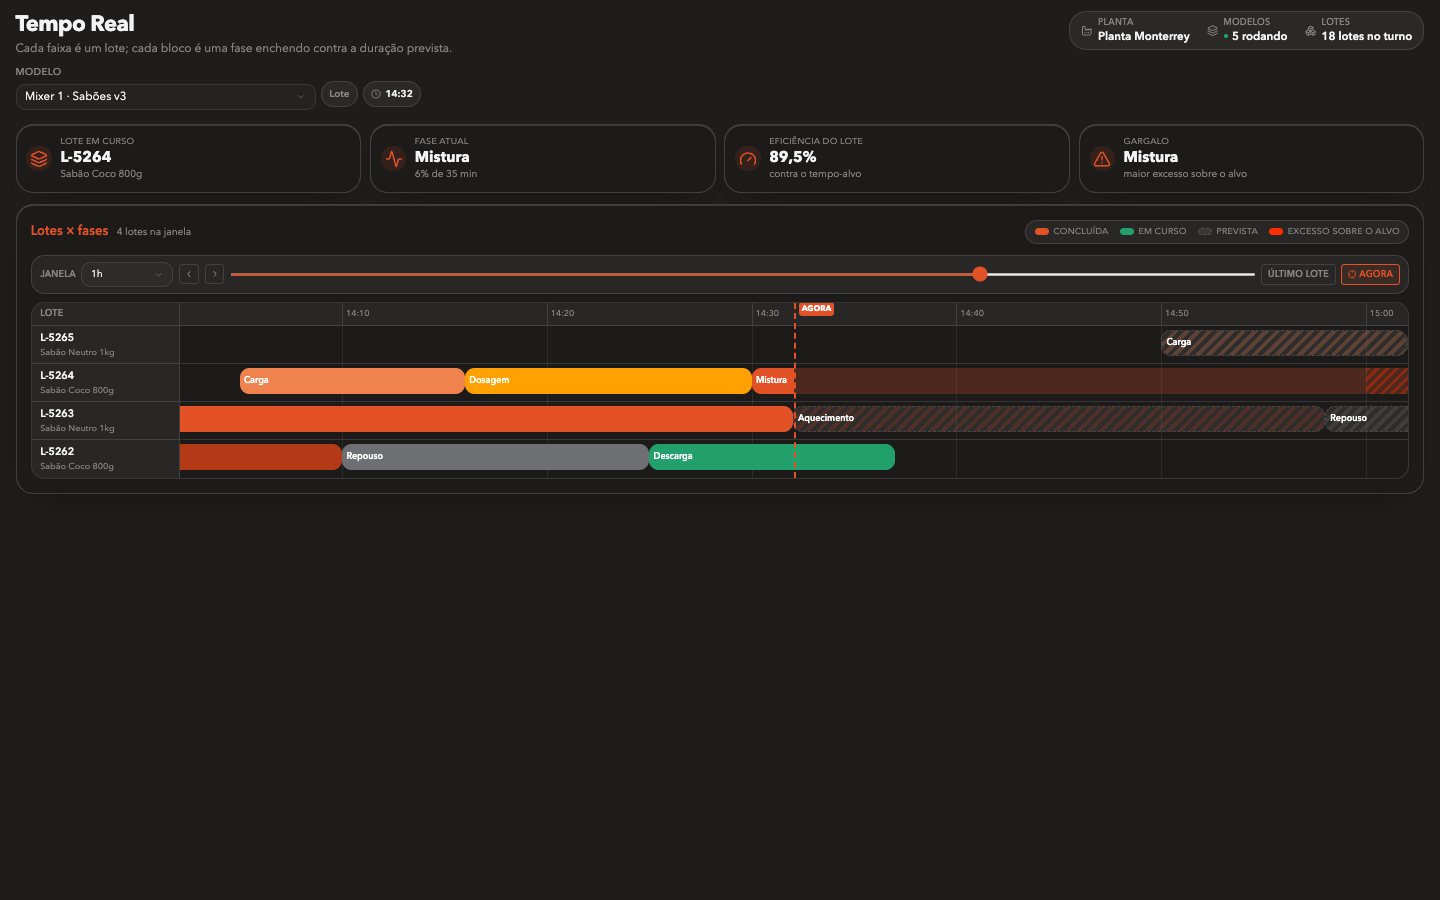
Real product screen: Live process
Live process Enlarge
How it works

From the data that comes in to the decision that goes out.

  1. 1

    Tags get connected

    Process tags are read plug and play, with no integration project and without touching the control logic.

  2. 2

    The process is broken into stages

    Each stage gets its equipment, its variables and what counts as normal there.

  3. 3

    Every stage reads live

    Rate, consumption and loss appear per stage, isolated per equipment, while the batch is still running.

  4. 4

    The deviation shows where it starts

    The drift is seen at the stage that caused it, not at the end of the line when the product is already made.

Requirements

What it takes to go live.

Data it needs

Process tags (plug and play)

This is the hard requirement. Without it, the capability has nothing to read.

What the plant needs

  • Process tags available on the PLC, the instrument or a gateway.
  • A stage map of the process, even a rough first version.
  • Network reach from the panel to the plant network.
  • What counts as normal for each variable.
Where it acts

The stage of the plant this capability lights up.

Results delivered

What becomes possible.

  • The shift knows which stage is holding the batch back while it is still running.
  • Loss stops being a plant total and gets an owner: one stage, one equipment.
  • A deviation is corrected during the batch instead of explained in the next meeting.
  • Every batch leaves a comparable record, stage by stage, for the other capabilities to use.
Examples of use

On the floor, it looks like this.

Four stages, one extra consumption

See which stage is burning the extra steam instead of dividing the bill across the whole line.

The mixer that drifts mid batch

The drift appears while the batch runs, in time to correct instead of explaining later.

Energy per stage, not per plant

Consumption stops being a single meter and becomes a number per equipment.

Benefits by role

What each side of the operation gains.

Operation

The running batch appears stage by stage, so the operator acts on the stage that is drifting instead of waiting for the end.

Quality and process

Every variable is read where it happens, which turns "the batch went wrong" into a stage, an equipment and a moment.

Management

Loss and consumption arrive already broken down by stage, so investment goes to the equipment that is really costing.

Integrations

It does not work alone.

Every capability reads from and feeds the others. What this one exchanges inside the operation:

APC

Stabilize the process

Stabilization lives on top of this capability. The stages, the variables and the setpoint readings it corrects all come from here.

Open capability
OEE

Efficiency and losses

Stage losses explain the plant level loss. One says how much, the other says where.

Open capability
RMS

Best recipe

Readings per stage are what turn a batch into a comparable run, and what makes a golden batch possible.

Open capability
IPM

Want to see this on your own data?

Send the tag list of one line. In the demo we read it live and break the process into stages with you.